
Monitoring Node Apps on CloudFoundry

There are a few options for monitoring Node applications including NewRelic and NodeTime but I’ll be looking at StrongOps (previously known as NodeFly) by StrongLoop. It’s easy to get up and running with both NewRelic and NodeTime but the StrongLoop offering is particularly easy on CloudFoundry thanks to its custom build pack for deploying applications on Cloudfoundry, more on that later. They also have a lot to offer Node projects in addition to monitoring, check out their website for all the details. StrongLoop also do a lot of work on Node itself so arguably they know more about Node than most.
Creating an application
To get started you need an account at StrongLoop and to download their suite. This includes a command line tool slc which includes extra helper commands to get the most out of their offerings including some sample applications. I’ll use a simple instant messaging application to get started.
slc example chat my-chat
cd my-chat
slc install
node app.js
The application should start and be available at http://localhost:1337, try opening it in several windows and talking to yourself.
Monitoring with StrongOps
Now there is a working application let’s get it running with StrongOps locally before deploying to Cloudfoundry. Create a StrongOps account if you haven’t already and then on the command line use slc to associate the application with StrongOps. Staying in the root of the application.
slc strongops
Please enter your: email address:
Please enter your: password:
You are now logged in. Welcome back, cgfrost.
Your StrongOps credentials were written to: ./strongloop.json
A strongloop.json file will be created in the root of the application that contains all the details needed to talk to the StrongLoop servers. There is an option to use package.json instead if you wish. Running the application again would send monitoring information to the StrongOps console but lets keep going and deploy to Cloudfoundry first.
Running on Cloudfoundry
Login in to your favourite Cloudfoundry provider, I’m using Anynines which currently have a free public beta. They are running on Cloudfoundry V2, it is not possible to run StrongOps on Cloudfoundry V1 as V1 doesn’t support custom buildpacks. Buildpacks are originally a concept that Heroku came up with, it is a piece of code that deploys and starts certain application types on a PaaS. It’s through buildpacks that PaaSs like Heroku and Cloudfoundry can support so many different runtimes. To use Anynines the best way to get going if your new to Cloudfoundry is to install their a9s Ruby Gem, see here for details. Once you have an account start by targeting and logging with the cf command line tool.
cf target https://api.de.a9s.eu
cf login
Create a manifest.yml file to tell Cloudfoundry how to deploy the application. The cf command can create an application manifest but some of the config required will be missing. This is the manifest required for the sample chat application.
---
applications:
- name: chat
  memory: 512M
  instances: 1
  host: chat
  domain: de.a9sapp.eu
  command: node app.js
  buildpack: https://github.com/strongloop/dist-paas-buildpack.git
  path: .
This manifest contains come common Cloudfoundry config such as memory and the number of instances as well as specifying the start command and buildpack to use. The command configuration should give the same command used to run the application locally, it’s required as Cloudfoundry isn’t able to detect every type of application and this ensures the Node application will actually be started. The buildpack configuration tells Cloudfoundry to explicitly use a buildpack from StrongLoop. This provides the StrongLoop Suite including the same version of Node as you have locally for development as there is no guarantee the version the Cloudfoundry provider has in its Node buildpack will match.
cf push
Once the application is pushed, go to your browser and test that the application is running (http://chat.de.a9sapp.eu with the above manifest). Talk to yourself some more to generate some traffic. There should now be traffic reported in the StrongOps console, http://strongloop.com/ops/dashboard. I found there is a minute or two of lag so be patient.
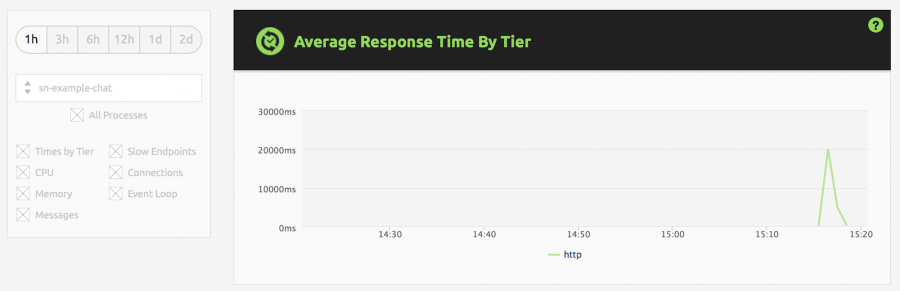
Have a look around the console to see what metrics are available and try out the memory/CPU profiling. The metrics will be a little limited by the simple sample application but it will give you a good idea of what’s there. There are also some features only available to the paid plans. Happy monitoring.
1 Comment
-
Christopher Frost | NodeJS on Cloudfoundry – New Buildpack
[…] my last post about monitoring NodeJS applications on CF (Cloud Foundry) things have changed, both the NodeJS and CF worlds are […]